
end of header
Longitudinal Employer-Household Dynamics
National QWI (NQWI) Data (Beta)
Lars Vilhuber
Overview of National Quarterly Workforce Indicators
This is a beta release from the U.S. Census Bureau of new national statistics on quarterly workforce indicators in the United States constructed from LEHD data. The official release of the data will occur in late 2015. The new national data series is compiled from published state-level Quarterly Workforce Indicators (QWI).
Data sources
The National QWI are derived from existing public-use state-level QWI (see "QWI 101" for details). The data underlying the QWI are provided by the Census Bureau's state partners under memorandi of understanding (MOUs). Public-use data from the Bureau of Labor Statistics' (BLS) Quarterly Census of Employment and Wages are used indirectly in the imputation methodology.
Methodology
The procedures used by the Census Bureau to construct the National QWI, first developed by Abowd and Vilhuber (2010, 2011) and subsequently improved by Abowd, Goel, Raghunathan, and Vilhuber (forthcoming), take into account the lack of data for certain states and time periods as well as suppressions of certain values in the QWI for statistical disclosure limitation. Using multiple imputation models that account for missing data (Rubin, 1987), the methodology generates a consistent estimate of the national series, including measures of its uncertainty.
More detailed information on the methodology is available in Abowd and Vilhuber (2011), "National estimates of gross employment and job flows from the Quarterly Workforce Indicators with demographic and industry detail", Journal of Econometrics, Volume 161, Issue 1, March 2011, Pages 82-99.
Confidentiality protection
The National QWI are entirely derived from public-use data products. For a detailed explanation of the disclosure avoidance techniques used to protect the underlying state-level QWI, see Abowd, et. al., Confidentiality Protection in the Census Bureau's Quarterly Workforce Indicators.
Release frequency
At present, National QWI are a beta product, and no firm release schedule has been established. However, we expect to release National QWI on a quarterly frequency, with final estimates becoming available near the end of each calendar quarter, shortly after the last state-level QWI have been released. As with the state-level QWI, we currently release full revisions of the entire time-series each time the underlying state-level QWI are revised.
This page will be refreshed to reflect the latest availability. Released files are listed later in this document.
New features
QWI in rates
In addition to the standard count and magnitude data published as per QWIPU Data Schema v4.0, ratios of those counts to an appropriate denominator ("rates") are also published. QWIPU Data Schema v4.0 (also see draft LEHD Data Schema 4.1c-draft ) already introduced 3 indicators as rates : End-of-Quarter Hiring Rate (HirAEndR), Beginning-of-Quarter Separation Rate (SepBegR), Replacement Hiring Rate (HirAEndReplr). The draft LEHD Data Schema V4.1c-draft specifies a new category of files for rates, e.g. qwir_. In general, rates for indicator X, denoted by XR, are computed as
\[XR_t = \frac{X_t}{\frac{1}{2} ( Emp_t + EmpEnd_t )}\]
for indicators that use point-in-time employment as their base, and as
\[XR_t = \frac{X_t}{\frac{1}{2} ( EmpS_t + EmpSpv_t )}\]
for indicators that use full-quarter (stable) employment as their base. Rates are published as fractions. Note that all rates can be computed from the released count data, they are only provided as a convenience for users. In LEHD Data Schema V4.1c-draft, the rates already present on the "regular" QWI data file are replicated (note rename of TurnOvrS to TurnOvrSR for naming consistency).
Variability measures
Using the multiple implicates generated by the methodology used to create the National QWI, variability measures are available to make proper statistical inferences using the National QWI. For more information on these measures, see Abowd and Vilhuber (2010, 2011) and McKinney, Green, Vilhuber, and Abowd (forthcoming), "Total Variability Measures for Selected Quarterly Workforce Indicators and LEHD Origin Destination Employment Statistics in OnTheMap". Details on (draft) specifications of variable names of the release file for variability measures for levels and rates are outlined at LEHD Schema V4.1c-draft. The variability measures include standard errors, total variability, components of the total variability (average within-implicate variability and between-implicate variability), as well as degrees of freedom for each published cell. Standard errors and variance components have been rounded to the nearest integer for counts, and to the fourth decimal for rates (fractions). Degrees of freedom have been rounded to the nearest integer.
90% confidence intervals for an indicator X (or a rate XR) can be computed as
\[[X_t - t(0.95,df\_X_t) st\_X_t, X_t + t(0.95,df\_X_t) st\_X_t ]\]
On this particular beta release and aggregation level, no degree of freedom statistics is smaller than approximately 300, and simplified approximate 90% confidence intervals of an indicator X can be computed as
\[[X_t - 1.645 st\_X_t, X_t + 1.645 st\_X_t ]\]
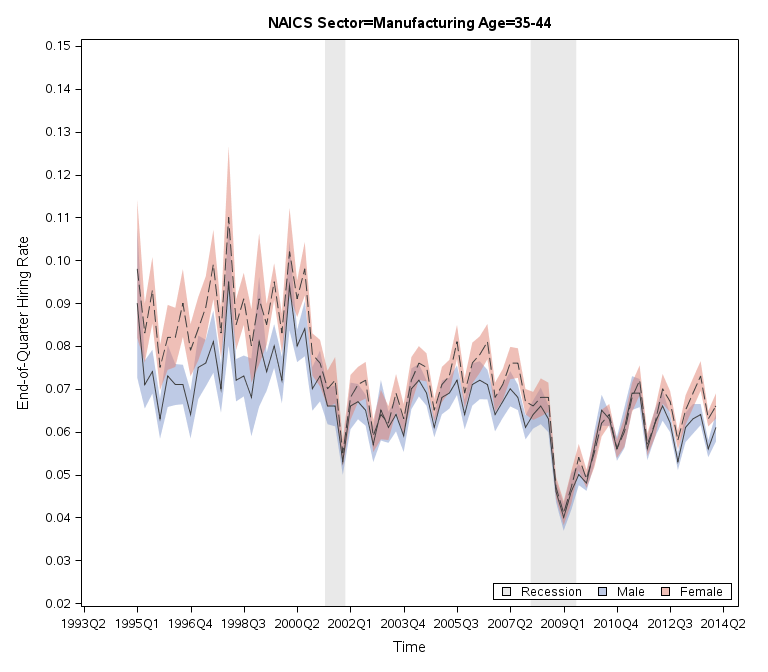
Examples of using variability measures and published rates
For instance, one could consider whether the hiring rates for men and women aged 35-44 in manufacturing were significantly different from each other over the time period covered by the National QWI. The figure below, where confidence bands were computed using the formula above, shows that this is not the case, as the confidence intervals overlap:
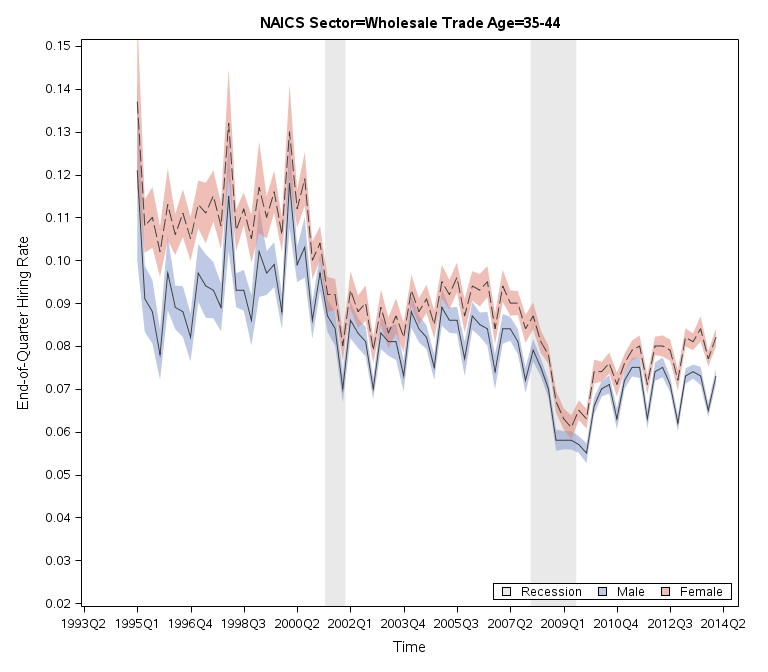
If we were to consider wholesale trade, however, the figure below indicates that hiring rates were significantly higher for women than for men, in many but not all periods (only rarely do the confidence intervals overlap).
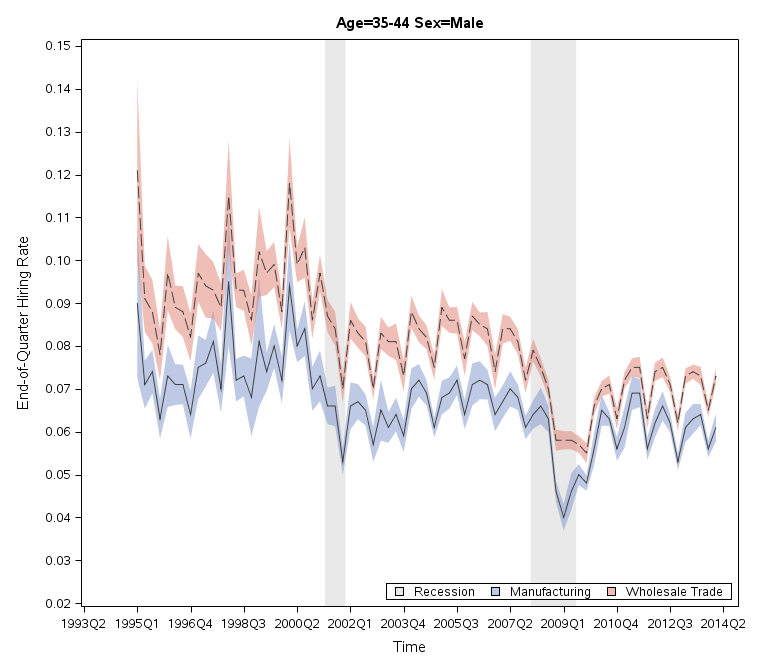
Finally, if we were to consider whether men aged 35-44 in different industries faced different hiring rates across time, the figure below, for manufacturing and wholesale trade, show that in almost all periods, hiring rates are significantly higher in wholesale trade.
Seasonal adjustment
Seasonally adjusted levels and rates will be released at a later date.
Downloadable data
Currently, not all tabulation categories present in state-level QWI are available for National QWI. Ongoing work will lead to additional tabulation categories being made available, in line with existing state-level QWI (ownership, lower-level industry classifications).
Data files are provided in CSV format, and can be downloaded from lehd.ces.census.gov/data/qwi/latest_release/us. The format of the file names and data content is described at lehd.ces.census.gov/data/schema/ (see the "version" text files in lehd.ces.census.gov/data/qwi/latest_release/us for the current schema version). These data are also available via QWI Explorer and the LED Extraction Tool.
List of available files
Go to lehd.ces.census.gov/data/qwi/latest_release/us to download the three most recent releases of NQWI data. Each release contains the full QWI time series, so we recommend users download the most recent release. The latest quarter of data is typically three quarters behind the quarter of release (four quarters for firm age and size). We recommend that users do not combine data from separate releases.Feedback
Please send questions and comments to lars.vilhuber@census.gov.
 algorithm, which appends a ".gz" to the end of the filename. Most commonly used compression/ext
raction software packages can decompress these files (see http://en.wikipedia.org/wiki/Zip_(file_format)
).
algorithm, which appends a ".gz" to the end of the filename. Most commonly used compression/ext
raction software packages can decompress these files (see http://en.wikipedia.org/wiki/Zip_(file_format)
).